R&D
Visualization
ANYFASTBig Data Analysis Visualization Tools
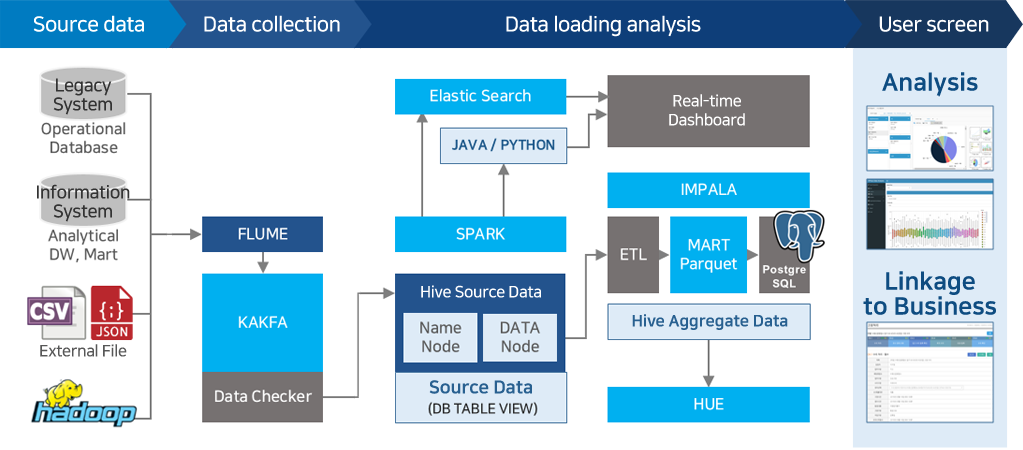
Visualization of big data collection, Cleansing, Analysis and sharing processes
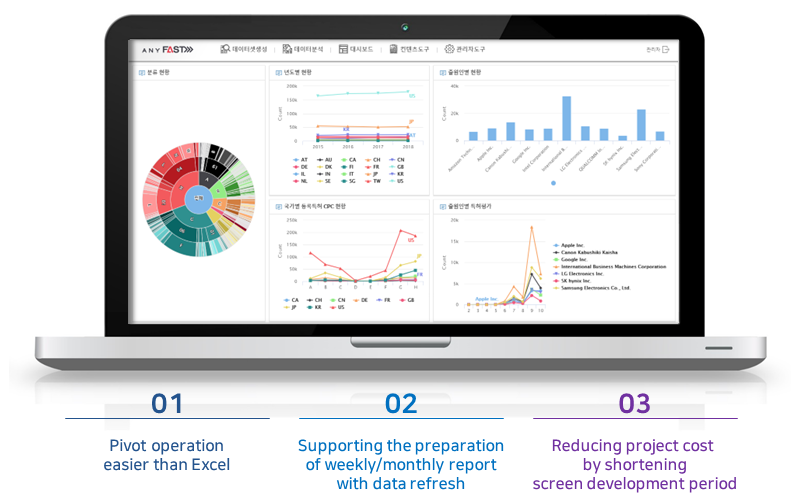
Major functions
- Analysis is possible after joining n data sets without the support of a separate solution.
- Drill down between multiple data sets is supported.
- A corresponding filter can be added to each dimension.
- Two functions of the server query mode and the client operating mode (standalone function)
- The function of user-defined GroupData. For example, the grouping of Friday + Saturday + Sunday = “Weekend”
- Prediction simulation using the what-if function
- Setting the condition of data set inclusion and exclusion only by clicking
- User-defined computed field
- Simultaneous analysis of composite data set through WorkBoard that combines heterogeneous
- Supporting the easy drill function by one click
- Easy WYSIWYG dashboard screen configuration through drag & drop
Adoption Effects
- Ad-hoc Query: Supporting decision-making by immediate response to unstructured query
- Large Data: Easier handling of mass data
- ① Fast implementation: It is possible to analyze data of desired form as soon as AnyFAST is introduced.
- ② Easy to Use: With the minimum education, the end user can use easily only by clicking through AnyFAST.
- Powerful: The user can directly load and analyze various data.
- Flexible: The analysis and query of data in the forms of dimension and measure is performed.
- Integrated: Enterprise data are gathered and dashboard report and analysis are performed by a single solution within a single architecture.
- Cost: Implementation and use within a short time enables rapid investment recovery.
- R Support: It is possible to embed a frequently used package among thousands of R packages.